Online monitoring of small volume reactions using compact liquid chromatography instrumentation
 Abstract
A wide variety of analytical techniques have been employed for monitoring chemical reactions, with online instrumentation providing a number of benefits compared to offline analysis. A challenge in the past for online monitoring has been placement of the monitoring instrumentation as close as possible to the reaction vessel to maximize sampling temporal resolution and preserve sample composition integrity. Furthermore, the ability to sample very small volumes from bench-scale reactions allows the use of small reaction vessels and conservation of expensive reagents. In this study, a compact capillary LC instrument was used for online monitoring of as small as a 1 mL volume of chemical reaction, with automated sampling of nL-scale volumes directly from the reaction vessel. Analyses to demonstrate short term (~2 h) and long term (~ 50 h) reactions were conducted using tandem on-capillary UV absorbance followed by in-line MS detection or UV absorbance detection alone, respectively. For both short term (~2 h) and long term (~50 h) reactions (10 and 250 injections, respectively), sampling approaches using syringe pumps minimized the overall sample loss to ~0.2% of the total reaction volume.
1. Introduction
Bench-scale reaction monitoring is a common practice in both academic and industrial settings. By tracking reactant consumption, product formation, and potential presence of impurities overtime, optimization of reaction kinetics can be achieved prior to scaling up a selected synthetic route [1][2]. Generally, reaction monitoring is achieved through manual sampling and offline analysis of a reaction using techniques such as optical spectroscopy [3], GC [4], LC [5], MS [6], and/or NMR [7]. More recently, online reaction monitoring has been adopted to further increase the number of data points gathered in a given reaction as well as reduce the overall volume needed for an individual sample [8][9][10]. To further reduce the amount of sample taken from the reaction vessel for analysis, techniques that require minimal volume such as capillary LC can
be implemented [11]. The automated nature of online monitoring provides for more representative sampling of the reaction, as offline approaches can lead to the loss of volatile compounds and/or unstable reaction intermediates, especially if there are long delays between sampling and analysis [9][12]. One challenge in performing on-line reaction monitoring of bench-scale reactions is the size of the instrumentation relative to the fume hood in which the reaction is performed, as lengthy
tubing connections can reduce the temporal resolution of sampling. To accommodate instrumentation within the hood adjacent to the reaction vessel, compact formats are preferred.
Recently, a number of various compact LC instruments have been reported [13][14][15][16][17], with some coupled to small footprint MS instruments for detection as well [18][19][20]. For reaction monitoring purposes, a small LC system using columns in a microfluidic format was coupled to several organic reactions for on-line analysis [21]. More recently, a compact LC-UV-MS instrument was coupled to commercial reaction vessels and larger reaction workstations, primarily focused on on-line process monitoring in a pharmaceutical industry setting [11]. The same compact MS has also been coupled directly to a reaction vessel for sampling, using an in-line membrane-based phase separator rather than a chromatographic separation [22]. In this study, a different integrated compact LC platform was implemented for on-line monitoring of smaller reaction volumes (on the order of 10-30 mL) with a standard syringe pump for sampling, representing a common strategy that may be used in academic and small-scale R&D environments as an alternative to some larger-scale automated samplers [23]. As a demonstration of this approach, imine formation and acid hydrolysis reactions were monitored using compact on-line LC-UV-MS and LC-UV instruments, respectively.
2. Materials & Methods
2.1 Imine Formation Reaction Monitoring
2.1.1 Chemicals
Acetonitrile and methanol used as reaction solvents and mobile phases were both OmniSolv LC- MS grade (EMD Millipore, Billerica, MA, USA). Chromasolv LC-MS grade water was acquired from Honeywell (Muskegon, MI, USA). Formic Acid (98%+ purity) and 4 dimethylaminobenzaldehyde (DMABA, 98%+ purity) were obtained from TCI America (Portland, OR, USA). Isopropylamine (99% purity) was purchased from Beantown Chemical (Hudson, NH, USA).
2.1.2 Reaction Conditions
The reaction between DMABA and isopropylamine is shown in Scheme 1. The approach was based on previous studies that explored various conditions for this type of reaction monitored by off-line HPLC [24]. The reaction was initiated when 30, 100, or 300 μL of isopropylamine were added to 30 mL of 0.2 mM DMABA in 1:1 acetonitrile/methanol. The reaction mixture was
stirred and heated to 45oC during the entire 2-3 h reaction period, and samples were taken for analysis every 13 min.
2.1.3 Instrument Set-Up
Sample was continuously drawn from the reaction vessel and through an Axcend Focus LC (Axcend, Provo, UT, USA) equipped with a 40 nL injection valve loop using a Fusion 200 syringe pump
(Chemyx, Stafford, TX, USA), which was operated in the withdraw mode at a rate of 0.5 μL/min over the course of the reaction. Connections from the vessel to the injection valve and from the injection valve to the syringe pump were made using 30 μm inner diameter (i.d.) polyimide- coated fused silica capillaries (Polymicro Technologies, Phoenix, AZ, USA), with a 1 μm
microfilter assembly (Idex, Oak Harbor, WA) placed in-line between the reaction vessel and injection valve to prevent particulate material from entering the injection loop and separation column. Separation of the reaction mixture was performed using a UV transparent (i.e., Teflon outer coating) 100 mm x 0.150 mm i.d. fused silica capillary column (Polymicro Technologies) packed with 1.7 μm C18 fully porous particles (CoAnn Technologies, Richland, WA, USA). Mobile phase A was 97:3 water/acetonitrile and mobile phase B was 3:97 water/acetonitrile, both modified with 0.1% formic acid. The mobile phase flow rate was 1.5 μL/min and the gradient program was 10% B – 75% B over 7 min, back to 10% B over 1 min, and then hold for 1 min at 10% B. The total cycle time was ~13 min including the syringe fill and pressurization sequence. Both on-capillary UV absorbance detection (255 nm) and single quadrupole MS detection in selected-ion- monitoring mode (MiD-4500, Microsaic, Woking, UK) at m/z values of 150 (DMABA) and 190 (imine product) were used. After the on-capillary absorbance detector, a 20 cm segment of 50 μm i.d. PEEKsil tubing (1/32” outer diameter, Trajan, Ringwood, Victoria,
AU) was used to connect the column outlet to the MS source. The ESI source was set at 850 V, with a nitrogen flow rate of 2500 mL/min and a vacuum interface voltage of 70 V. A short capillary was connected to the in- source flow splitter to reduce the flow directed to the MS to 0.6 μL/min. A general schematic of this set-up is shown in Figure 1 and a photograph is shown
in Figure S1.
2.2 Aspirin Hydrolysis in Acidic Conditions
2.2.1 Chemicals
Water, acetonitrile, phosphoric acid (all HPLC grade) and acetylsalicylic acid (aspirin) were all purchased from Sigma-Aldrich (St. Louis, MO, USA).
2.2.2 Reaction Conditions
Acid hydrolysis of 10 mg of aspirin (Scheme 2) was conducted in a solution containing 0.3 mL of concentrated phosphoric acid and 0.5 mL of 50:50 water/acetonitrile in a 3.7 mL (one-dram) reaction vial with stirring over an approximately 50 h period. Samples were automatically withdrawn from the reaction mixture and analyzed every 12 minutes.
2.2.3 Instrument Set-Up
A similar set-up as shown in Figure 1 was used for on-line monitoring of the acid hydrolysis of aspirin (Scheme 2), the main difference being that the reaction was conducted in a smaller volume and over a longer period of time compared to imine formation reaction monitoring. A prototype nano/micro LC syringe pump (ePrep, Oakleigh, AU) was used to withdraw
approximately 6 μL of solution through the sampling tubing and a 4 nL injection loop prior to analysis, and push the remainder of the volume back into the reaction vial immediately after injection. In this experiment, 150 μm i.d. fused silica capillaries were used for the connections between the vial, loop, and syringe pump. The column, mobile phases, and on-column detector wavelength were the same, although the gradient program was changed to 5-95% B in 5 min at a flow rate of 2 μL/min. A photograph of this set-up is shown in Figure S2.
3. Results & Discussion
3.1 On-Line Reaction Monitoring of Imine Formation with Compact LC-UV-MS Instrumentation
In on-line reaction monitoring, maintaining the reaction within a chemical fume hood and bringing the instrumentation closer to the reaction vessel ensures safety and allows for use of existing reaction set-ups. To achieve this within a standard size chemical fume hood, minimizing the size of the instrument(s) is critical, e.g., LC and/or MS. Here, an integrated compact LC
instrument was operated directly next to a small reaction vessel, with a small syringe pump for sample withdrawal to simplify the process compared to larger, more expensive commercial reaction samplers. The formation of an imine product through the reaction of a benzaldehyde compound and an amine-containing compound (Scheme 1) was selected as a reaction to explore
because the benzaldehyde reactant and imine product could both be monitored by UV and MS detectors. Additionally, a similar reaction has previously been monitored with an on-line LC- based analysis using standard benchtop instrumentation [25].
In Figure 2A, the separation of the two species is shown as monitored by the on-column UV absorbance detector, with the peak area of the DMABA reactant (elution time of ~5.7 min) decreasing over time and the peak area of the imine product (elution time of ~3.7 min) increasing as the reaction proceeds. The extracted ion chromatograms (XICs) for each of these compounds
with MS detection is shown in Figure 2B, which depicts an identical trend in reactant consumption and product formation. The benefit of adding MS to this on-line monitoring approach is the capability for selective mass-based detection. However, an analyte’s response to a detector cannot be assumed to remain identical across detection methods [25]. With soft MS ionization techniques such as ESI, samples with readily ionized groups are overrepresented compared to more neutral compounds [26][27], while differences in molar absorptivity can lead to similar issues with UV detection [28]. In order to account for this discrepancy, a relative response factor (RRF) can be calculated through use of an internal standard [29][30]. This poses an issue when applying internal standards to RRF calculations for on-line reaction monitoring, as the introduction of additional reagents could potentially result in the formation of side products [31][32]. Here, an alternate approach using the signals from two different instruments, avoiding the need for an internal standard, was applied to the calculations of RRF for potential differences between UV absorbance and MS detection [25][32]:
RRF (Aldehyde)= Aldehyde Area %(MS)Aldehyde Area %(UV) (1)
RRF (Imine)= Imine Area %(MS)Imine Area %(UV) (2)
To normalize the dataset across the entire reaction period, the RRF was averaged from the calculated value of each collected chromatogram. Once the RRF was established, the MS dataset was adjusted by dividing the area percent of each compound (which is defined as the ratio of the area of an individual peak to the sum of the areas of all peaks in the chromatogram) by its respective RRF. This accounted for potential discrepancies in analyte response without the need for the introduction of an internal standard. Using this approach, the reaction kinetic curves based on the chromatograms obtained with both detectors are shown in Figure 2C. The effects of increasing the isopropylamine volume on the reaction are shown in Figure S3, with increasing volumes found to increase the overall rate of reaction. Although the general trend of the curves is very similar, there are slight differences between the detectors. This can be attributed to the improved detection limits of the MS; i.e., as the reactant peak area decreases over time, it eventually reaches a point where it is nearly undetectable in the UV absorbance chromatogram, but can still be clearly observed in the mass chromatogram. Thus, for reactions performed at low concentrations and/or with compounds with low molar absorptivities at a given wavelength, the use of LC-MS can provide advantages over LC-UV.
The use of miniaturized instrumentation for reaction monitoring not only provides benefits in terms of instrumentation size, but also in sample size. Given the small sample loop volume (40 nL), as well as the low withdrawal rate of the syringe pump (0.5 μL/min), the volume of reaction mixture lost during sampling is negligible. For this ~2h reaction (10 sample injections), a total sample volume of approximately 60 μL was withdrawn from a 30 mL reaction volume, resulting in a minimal loss of ~0.2% due to sampling. In the following section, a variation in the sampling approach was developed to minimize sample loss for longer reaction monitoring times where solely withdrawing the sample could lead to higher volume losses.
3.2 On-Line Dissolution & Hydrolysis Monitoring of Aspirin with Compact LC-UV Instrumentation
Acid hydrolysis reactions are commonly monitored in the pharmaceutical industry [33]. In this study, a simple one-dram reaction vial was used to contain a ~1 mL volume for the hydrolysis acetylsalicylic acid to salicylic acid based on the presence of phosphoric acid in the solution (Scheme 2). In Figure 3A, chromatograms selected at 8 h time points are shown over a period of two days. A slow increase in the peak area of the salicylic acid product is demonstrated in Figure 3B across nearly 250 chromatographic injections from the on-line vessel, with a total time of approximately 50 h. Performance of the system throughout this time period was consistent, with retention time repeatability of 0.5% RSD and 0.6% RSD for acetylsalicylic acid and salicylic acid, respectively.
In this set-up, a smaller vessel volume (~1 mL) and longer monitoring time (~50 h) require a different approach to on-line sampling than constant withdrawal. Here, the syringe was operated in a cyclic fashion where ~6 μL of sample volume were drawn through the connecting tubes prior to each injection to ensure that the injection loop was filled with fresh solution. Once the injection valve was actuated and the loaded 4 nL of sample was injected into the column, the remainder of the volume in the connecting tubes was pushed back into the vessel by switching the syringe pump to operate in the forward direction. This kept the total volume removed from the vessel across the entire monitoring period to ~1 μL, which is only an overall loss of 0.1% of the total reaction volume. Using this automated procedure not only simplifies the process for long experiments, but also ensures that the total loss due to sampling is negligible, especially for very low volume reactions.
The use of capillary LC is critical to the use of these sampling approaches for low volume reaction vessels, as small injection volumes <100 nL are most compatible with small i.d. columns. In this example, a 5 min gradient analysis at 2 μL/min consumes 5 μL of each solvent per run. The actual volume per run is slightly greater due to the equilibration time between each
chromatogram in the sequence, with total solvent consumption of ~18 μL of mobile phase A and ~6 μL of mobile phase B for each full cycle time. Thus, on-line monitoring for an entire week (168 h) would only consume ~20 mL of total mobile phase and <3.4 μL of sample (~0.4% of the reaction volume). This approach is not only beneficial in terms of minimizing the sample loss due to analysis throughout the course of a reaction, but also in terms of overall method “greenness” through a substantial reduction in mobile phase consumption [34].
4. Conclusions
The use of on-line analysis for bench-scale reaction monitoring provides multiple benefits compared to off-line strategies. Compact designs permit the necessary instrumentation to be coupled close to the reaction vessel, which can be advantageous in confined spaces such as chemical fume hoods. In this study, imine formation by condensation and acid hydrolysis of aspirin were monitored using a compact, on-line, integrated LC platform. Both on-capillary UV absorbance and in-line MS detection approaches were demonstrated, with the MS providing mass selective detection, albeit at higher cost and larger total instrument size. Because this platform utilizes capillary-scale LC columns, only nL-scale sample volumes was required for
each sample injection, reducing the total volume loss due to sampling to less than ~0.2% for both reactions. This workflow is well-suited to chromatographic-based on-line reaction monitoring for volumes in the 10 – 50 mL range, common in a variety of synthesis-focused laboratory settings.
Acknowledgements
Funding for this project was provided by the National Institutes of Health through award R44
GM137649. The content is solely the responsibility of the authors and does not necessarily
represent the official views of the National Institutes of Health. Matthew Morse and Greg Ward
(Axcend Corporation) are acknowledged for technical assistance.
Conflict of Interest Statement: XX, WRW, and MLL are associated with Axcend Corporation,
which is developing and commercializing technology described in this manuscript.
Figure Captions
Scheme 1. Formation of N,N-Dimethyl-4-[(isopropylimino)methyl]aniline from 4-DMABA and
isopropylamine.
Scheme 2. Acid hydrolysis of acetylsalicylic acid to salicylic acid and acetic acid.
Figure 1. Instrument schematic for on-line sampling from a small reaction vessel into a compact LC injection loop using a syringe pump in the withdrawal mode. The capillary LC column is contained within a column cartridge that contains an on-capillary UV absorbance detector, with the column outlet connected to either the MS inlet (for on-line LC-UV-MS) or a waste line.
Figure 2. (A) Chromatographic separations of reactants and products in an imine formation reaction mixture over time monitored using UV absorbance detection at 255 nm. The peak eluting at ~3.7 min represents the imine product and the peak at ~5.7 min represents the DMABA reactant. (B) In-line secondary detection by MS in the selected-ion-monitoring mode with m/z values of 150 and 190 selected for the DMABA reactant and imine product, respectively. (C) Reaction kinetic plot showing progression of product formation for both UV and MS detection. Area percentages were calculated as described in the text and MS data were corrected using the RRF approach described in Equations 1 and 2.
Figure 3. (A) Chromatographic separation of aspirin acid hydrolysis reactants and products collected via UV absorbance at 235 nm. The peak eluting at ~3.0 min represents acetylsalicylic acid and the peak at ~3.3 min represents salicylic acid. (B) Reaction kinetic plot showing salicylic acid formation as a function of time.
Online Monitoring of Small Volume Reactions Using Compact Liquid Chromatography Instrumentation
Samuel W. Foster1 , Xiaofeng Xie2,3 , Jacob M. Hellmig1 , Gustavo Moura-Letts1 , W. Raymond West2 , Milton L. Lee2,3 , James P. Grinias1,*
1.Department of Chemistry & Biochemistry, Rowan University, Glassboro, NJ 08028
2.Axcend Corporation, Provo, UT 84604
3.Department of Chemistry and Biochemistry, Brigham Young University, Provo, UT 84602
*Corresponding Author: James P. Grinias, [email protected]
Supporting Information
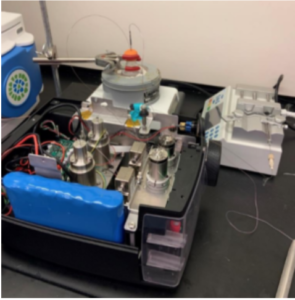
Figure S1. Photograph of instrument set-up used for online LC-UV-MS monitoring of an imine
formation reaction using compact instrumentation.
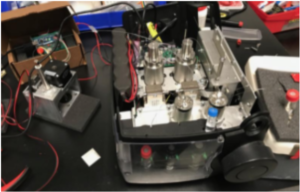
Figure S2. Photograph of instrument set-up used for online LC-UV monitoring of an acid
hydrolysis reaction using compact instrumentation.
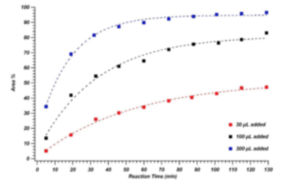
Figure S3. Increase in product peak area percentage (as measured by MS detection) for imine
formation reaction when 30 μL (red markers), 100 μL (black markers), and 300 μL (blue
markers) of isopropylamine were added to the reaction mixture.
References:
[1] Fitzpatrick, D. E., Battilocchio, C., Ley, S. V., A Novel Internet-Based Reaction Monitoring, Control and Autonomous Self-Optimization Platform for Chemical Synthesis. Org. Process Res. Dev. 2016, 20, 386–394.
[2] Chanda, A., Daly, A. M., Foley, D. A., Lapack, M. A., Mukherjee, S., Orr, J. D., Reid, G. L., Thompson, D. R., Ward, H. W., Industry perspectives on process analytical technology: Tools and applications in API development. Org. Process Res. Dev. 2015, 19, 63–83.
[3] Gurden, S. P., Westerhuis, J. A., Smilde, A. K., Monitoring of batch processes using spectroscopy. AIChE J. 2002, 48, 2283–2297.
[4] Cortés-Borda, D., Kutonova, K. V., Jamet, C., Trusova, M. E., Zammattio, F., Truchet, C., Rodriguez-Zubiri, M., Felpin, F. X., Optimizing the Heck-Matsuda Reaction in Flow with a Constraint-Adapted Direct Search Algorithm. Org. Process Res. Dev. 2016, 20, 1979–1987.
[5] Quinn, A. C., Gemperline, P. J., Baker, B., Zhu, M., Walker, D. S., Fiber-optic UV/visible composition monitoring for process control of batch reactions. Chemom. Intell. Lab. Syst. 1999, 45, 199–214.
[6] Sun, J., Yin, Y., Li, W., Jin, O., Na, N., Chemical Reaction Monitoring By Ambient Mass Spectrometry.Mass Spectrom. Rev. 2022, 41, 70–99.
[7] Foley, D. A., Dunn, A. L., Zell, M. T., Reaction monitoring using online vs tube NMR spectroscopy:Seriously different results. Magn. Reson. Chem. 2016, 54, 451–456.
[8] Gomez, M. V., De La Hoz, A., NMR reaction monitoring in flow synthesis. Beilstein J. Org. Chem. 2017, 13, 285–300.
[9] Ray, A., Bristow, T., Whitmore, C., Mosely, J., On-line reaction monitoring by mass spectrometry,modern approaches for the analysis of chemical reactions. Mass Spectrom. Rev. 2018, 37, 565–579.
[10] Malig, T. C., Koenig, J. D. B., Situ, H., Chehal, N. K., Hultin, P. G., Hein, J. E., Real-time HPLC-MS reaction progress monitoring using an automated analytical platform. React. Chem. Eng. 2017, 2, 309–314.
[11] Hemida, M., Haddad, P. R., Lam, S. C., Coates, L. J., Riley, F., Diaz, A., Gooley, A. A., Wirth, H. J., Guinness, S., Sekulic, S., Paull, B., Small footprint liquid chromatography-mass spectrometry for pharmaceutical reaction monitoring and automated process analysis. J. Chromatogr. A 2021, 1656, 462545.
[12] Fabris, D., Mass spectrometric approaches for the investigation of dynamic processes in condensed phase. Mass Spectrom. Rev. 2005, 24, 30–54.
[13] Sharma, S., Tolley, L. T., Tolley, H. D., Plistil, A., Stearns, S. D., Lee, M. L., Hand-portable liquid chromatographic instrumentation. J. Chromatogr. A 2015, 1421, 38–47.
[14] Rahimi, F., Chatzimichail, S., Saifuddin, A., Surman, A. J., Taylor-Robinson, S. D., Salehi- Reyhani, A., A Review of Portable High-Performance Liquid Chromatography: the Future of the Field?Chromatographia 2020, 83, 1165–1195.
[15] Foster, S. W., Xie, X., Pham, M., Peaden, P. A., Patil, L. M., Tolley, L. T., Farnsworth, P. B., Tolley, H. D., Lee, M. L., Grinias, J. P., Portable capillary liquid chromatography for pharmaceutical and illicit drug analysis. J. Sep. Sci. 2020, 43, 1623–1627.
[16] Coates, L. J., Lam, S. C., Gooley, A. A., Haddad, P. R., Paull, B., Wirth, H. J., Modular, cost-effective, and portable capillary gradient liquid chromatography system for on-site analysis. J. Chromatogr. A 2020, 1626, 461374.
[17] Chatzimichail, S., Rahimi, F., Saifuddin, A., Surman, A. J., Taylor-Robinson, S. D., Salehi- Reyhani, A., Hand-portable HPLC with broadband spectral detection enables analysis of complex polycyclic aromatic hydrocarbon mixtures. Commun. Chem. 2021, 4, 17.
[18] Vargas Medina, D. A., Maciel, E. V. S., de Toffoli, A. L., Lanças, F. M., Miniaturization of liquid chromatography coupled to mass spectrometry.: 2. Achievements on modern instrumentation for miniaturized liquid chromatography coupled to mass spectrometry. TrAC – Trends Anal. Chem. 2020, 128, 115910.
[19] Lam, S. C., Coates, L. J., Hemida, M., Gupta, V., Haddad, P. R., Macka, M., Paull, B., Miniature and fully portable gradient capillary liquid chromatograph. Anal. Chim. Acta 2020, 1101, 199–210.
[20] Hemida, M., Ghiasvand, A., Gupta, V., Coates, L. J., Gooley, A. A., Wirth, H. J., Haddad, P. R., Paull, B., Small-Footprint, Field-Deployable LC/MS System for On-Site Analysis of Per- And Polyfluoroalkyl Substances in Soil. Anal. Chem. 2021, 93, 12032–12040.
[21] Schafer, W. A., Hobbs, S., Rehm, J., Rakestraw, D. A., Orella, C., McLaughlin, M., Ge, Z., Welch, C. J., Mobile tool for HPLC reaction monitoring. Org. Process Res. Dev. 2007, 11, 870–876.
[22] Sheng, H., Corcoran, E. B., Dance, Z. E. X., Smith, J. P., Lin, Z., Ordsmith, V., Hamilton, S., Zhuang, P., Quantitative perspective on online flow reaction profiling using a miniature mass spectrometer. Org. Process Res. Dev. 2020, 24, 2611–2618.
[23] Patel, D. C., Lyu, Y. F., Gandarilla, J., Doherty, S., Unattended reaction monitoring using an automated microfluidic sampler and on-line liquid chromatography. Anal. Chim. Acta 2018, 1004, 32–39.
[24] Zameo, S., Vauzeilles, B., Beau, J. M., Direct composition analysis of a dynamic library of imines in an aqueous medium. European J. Org. Chem. 2006, 2006, 5441–5444.
[25] Foley, D. A., Wang, J., Maranzano, B., Zell, M. T., Marquez, B. L., Xiang, Y., Reid, G. L., Online NMR and HPLC as a reaction monitoring platform for pharmaceutical process development. Anal. Chem. 2013, 85, 8928–8932.
[26] Antignac, J. P., De Wasch, K., Monteau, F., De Brabander, H., Andre, F., Le Bizec, B., The ion suppression phenomenon in liquid chromatography-mass spectrometry and its consequences in the field of residue analysis. Anal. Chim. Acta 2005, 529, 129–136.
[27] Chetwynd, A. J., David, A., A review of nanoscale LC-ESI for metabolomics and its potential to enhance the metabolome coverage. Talanta 2018, 182, 380–390.
[28] Olsen, B. A., Argentine, M. D., Investigation of response factor ruggedness for the determination of drug impurities using high-performance liquid chromatography with ultraviolet detection. J. Chromatogr. A 1997, 762, 227–233.
[29] Gabelica, V., Rosu, F., De Pauw, E., A simple method to determine electrospray response factors of noncovalent complexes. Anal. Chem. 2009, 81, 6708–6715.
[30] Wang, M., Wang, C., Han, X., Selection of internal standards for accurate quantification of complex lipid species in biological extracts by electrospray ionization mass spectrometry—What, how and why? Mass Spectrom. Rev. 2017, 36, 693–714.
[31] Nussbaum, M. A., Baertschi, S. W., Jansen, P. J., Determination of relative UV response factors for HPLC by use of a chemiluminescent nitrogen-specific detector. J. Pharm. Biomed. Anal. 2002, 27, 983–993.
[32] Webster, G. K., Marsden, I., Pommerening, C. A., Tyrakowski, C. M., Tobias, B., Determination of relative response factors for chromatographic investigations using NMR spectrometry. J. Pharm. Biomed. Anal. 2009, 49, 1261–1265.
[33] Gilpin, R. K., Pachla, L. A., Pharmaceuticals and related drugs. Anal. Chem. 1999, 71, 217–234.
[34] Płotka, J., Tobiszewski, M., Sulej, A. M., Kupska, M., Górecki, T., Namieśnik, J., Green chromatography. J. Chromatogr. A 2013, 1307, 1–20.
Glen Mella. “Don’t Panic… It’s Déjà Vu All Over Again” Techbuzz.
https://techbuzz.news/don-t-panic-it-s-d-j-vu-all-over-again/Accesses 13 June 2022